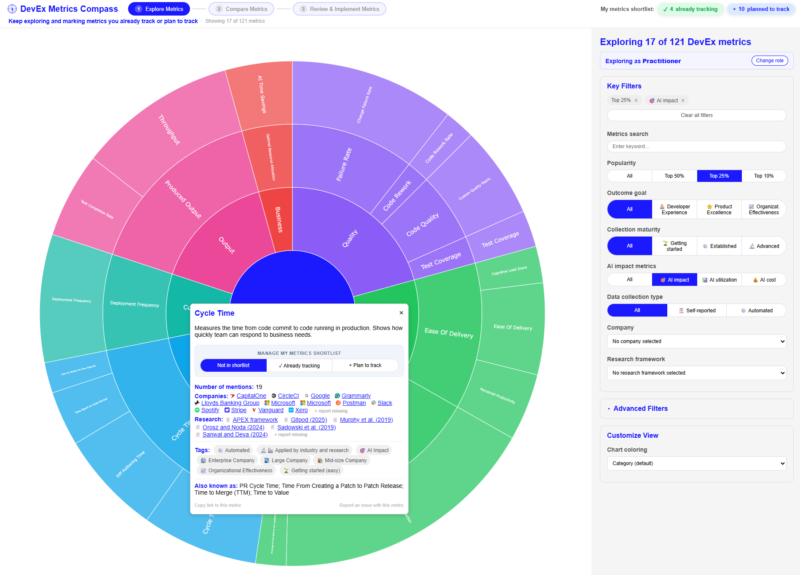
Companies are spending heavily on AI for software development, often $1,000+ per developer per month per the Stanford AI Spend Index, and naturally want to measure the impact of their investment. Is it just more output – commits, PRs, line of codes? Or also better outcomes – increased product quality, organizational effectiveness and Developer Experience (DevEx)?
Yet, measuring AI impact is hard. There are more than 120 DevEx metrics in circulation across 9+ frameworks, including SPACE, DORA, and DX Core 4. In such a fragmented landscape, the challenge is selecting the metrics that fit your goals, context, and measurement maturity, then instrumenting and interpreting them well enough to make meaningful improvements. Our new ACM Queue article explores the problem and presents the DevEx Metrics Compass, our solution for better navigating DevEx metrics.
Three misconceptions that derail measurement
Despite growing awareness of DevEx as a strategic concern, a handful of misconceptions keep undermining measurement in practice. Three stand out as especially common:
- “More metrics mean better insight.” Adding metrics without a clear hypothesis or goal creates noise, not clarity, and anchoring on just a single metric has the opposite problem. The challenge is not accumulation but deliberate selection: start from the problem you want to solve, define a hypothesis about its cause, then identify the metrics that let you observe whether an intervention like an AI rollout improves or worsens the situation.
- “Automated data is enough.” Logs and telemetry track trends well, but rarely explain why a metric changed. Self-reported signals from surveys and interviews surface the human experience behind the numbers, especially on dimensions like collaboration and cognitive load that automated data can’t capture.
- “There’s a perfect set of metrics for our company.” It’s tempting to adopt a popular framework or copy what a high-profile company does. But metrics need to be tailored to your own context, goals, and maturity, what works depends on your tooling, team structure, and situation.
The DevEx Metrics Compass
The DevEx Metrics Compass is a free, open-source web app we built on a structured analysis of 120+ metrics drawn from research and the public practices of 50+ engineering organizations, including Google, Microsoft, Atlassian, Spotify, and Stripe.
It doesn’t prescribe a framework, it helps you work across the ones that already exist, in three steps:
- Explore the full metrics landscape, filtered by popularity, outcome goal, maturity, or data-collection type.
- Compare your own metrics side by side against a framework or a peer company, to learn what you share and what you might be missing.
- Review and implement an actionable shortlist you can export and discuss with your team or leadership to shape implementation.
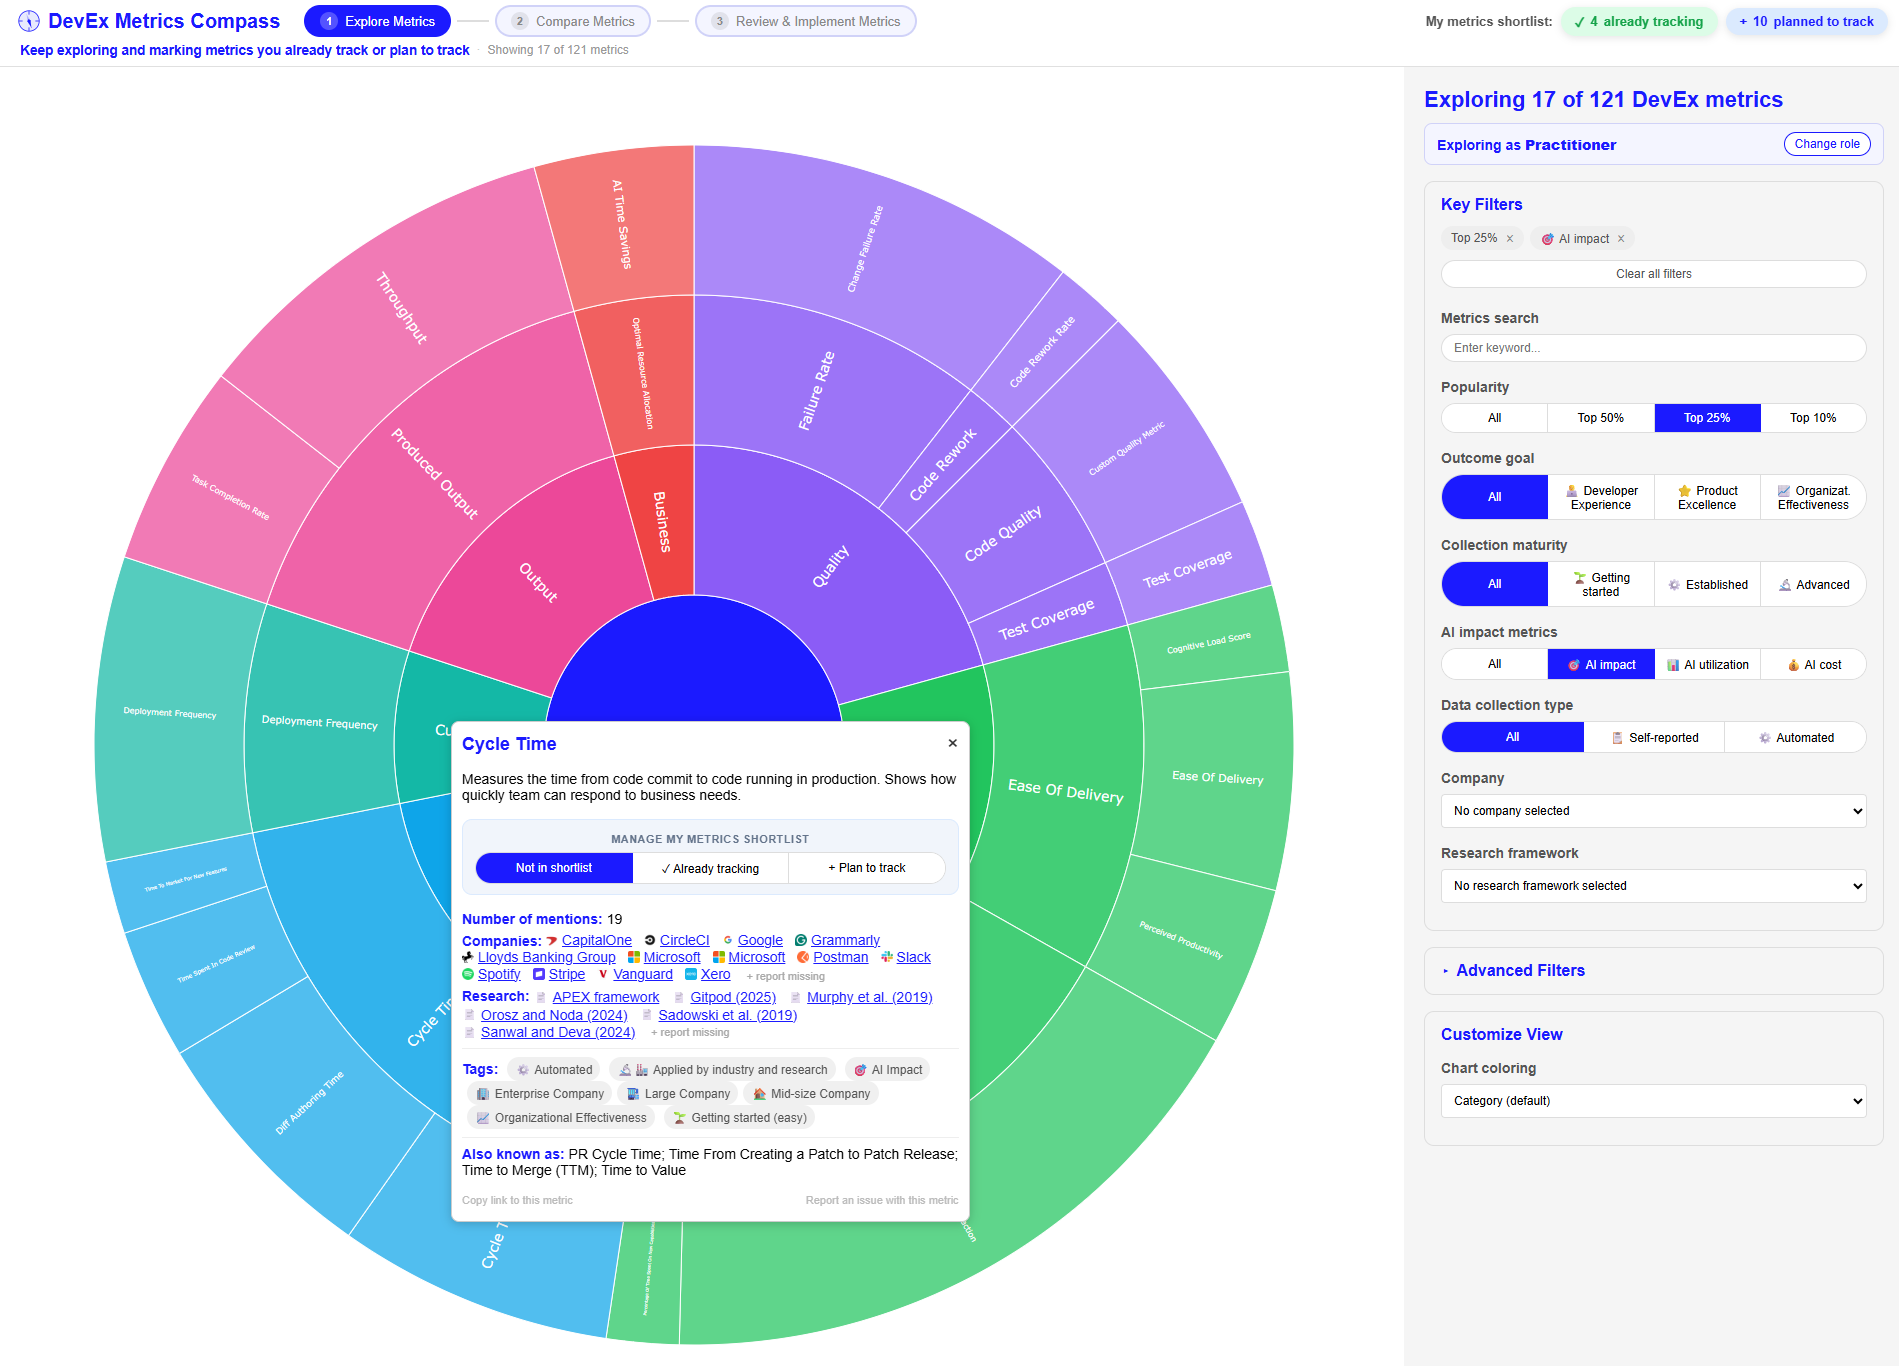
The dataset behind the Compass reveals that developer satisfaction is the single most-referenced metric across both research and industry, appearing in 45 sources, with the core DORA metrics close behind. AI-specific metrics like suggestion-acceptance rate are almost entirely industry-driven, with little research validation yet. And coverage thins out the further you move from daily engineering work toward business and customer outcomes, so the dimensions hardest to instrument are also the ones organizations understand least.
The Compass is built for practitioners to identify the right DevEx metrics, but also for researchers looking to identify where the field lacks validated measures.
How to try the Compass
- Read the full article, including the other misconceptions and what the dataset reveals and where the biggest gaps lie: devexcompass.com/paper
- Try the Compass: devexcompass.com
- The Compass is open-source. We welcome contributions on new metrics, frameworks or the tool itself on GitHub.
This project is based on a collaboration with my co-authors Gail C. Murphy, Thomas Fritz, and Patrick Meyer.


Comments are closed.